Number crunching 576 sets of data
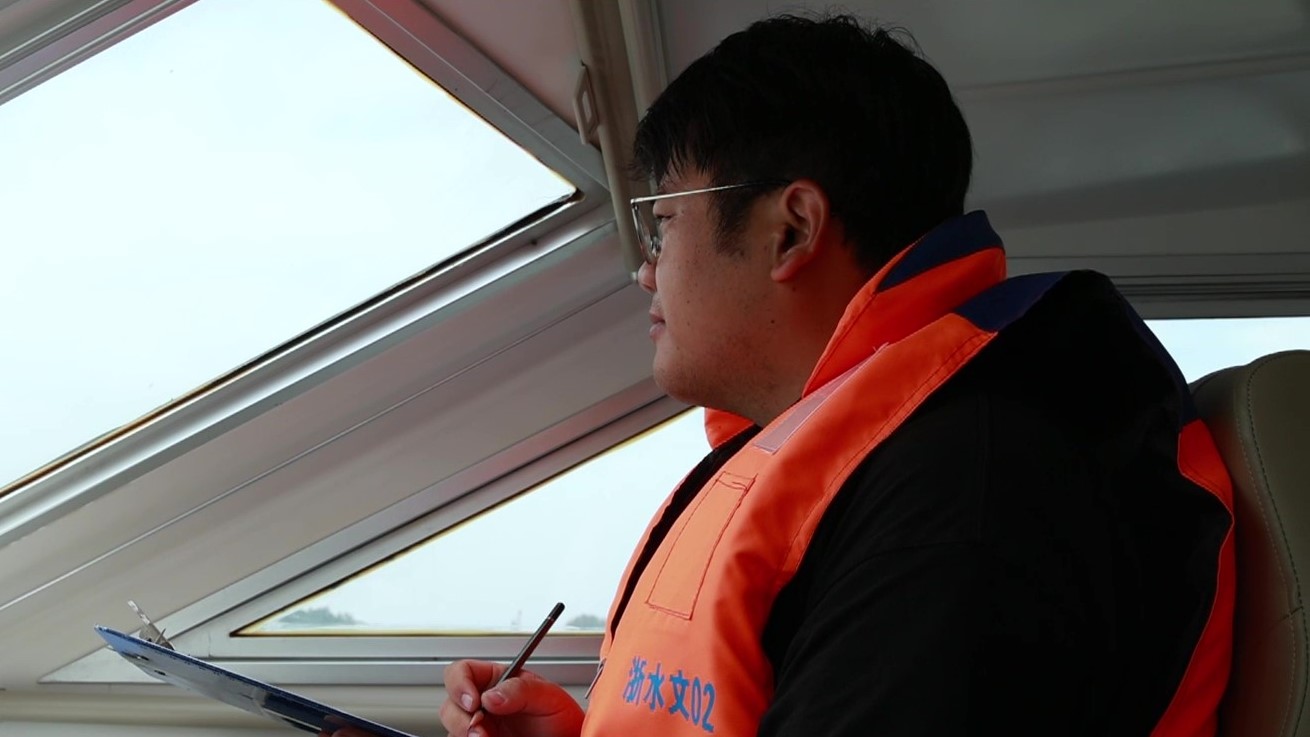
It is a routine for Shao and his colleagues every morning to check data concerning a series of indicators like the water level, rainfall, and flow rate before they share the flood information with provincial hydrological center. If the data is hugely different from the normal level, or the trend shown in the data indicates any exception, they need to investigate and find out the cause in person.
The data check is a test for patience. The two remote monitoring devices, amounted on the water level observing stations on the two sides of the river, output a set of data every five minutes on average. In total, there are 576 sets of data from the two devices every day. Considering that the automatic rain gauge, instrumented buoy and other devices also generate data, checking it all is a huge task.
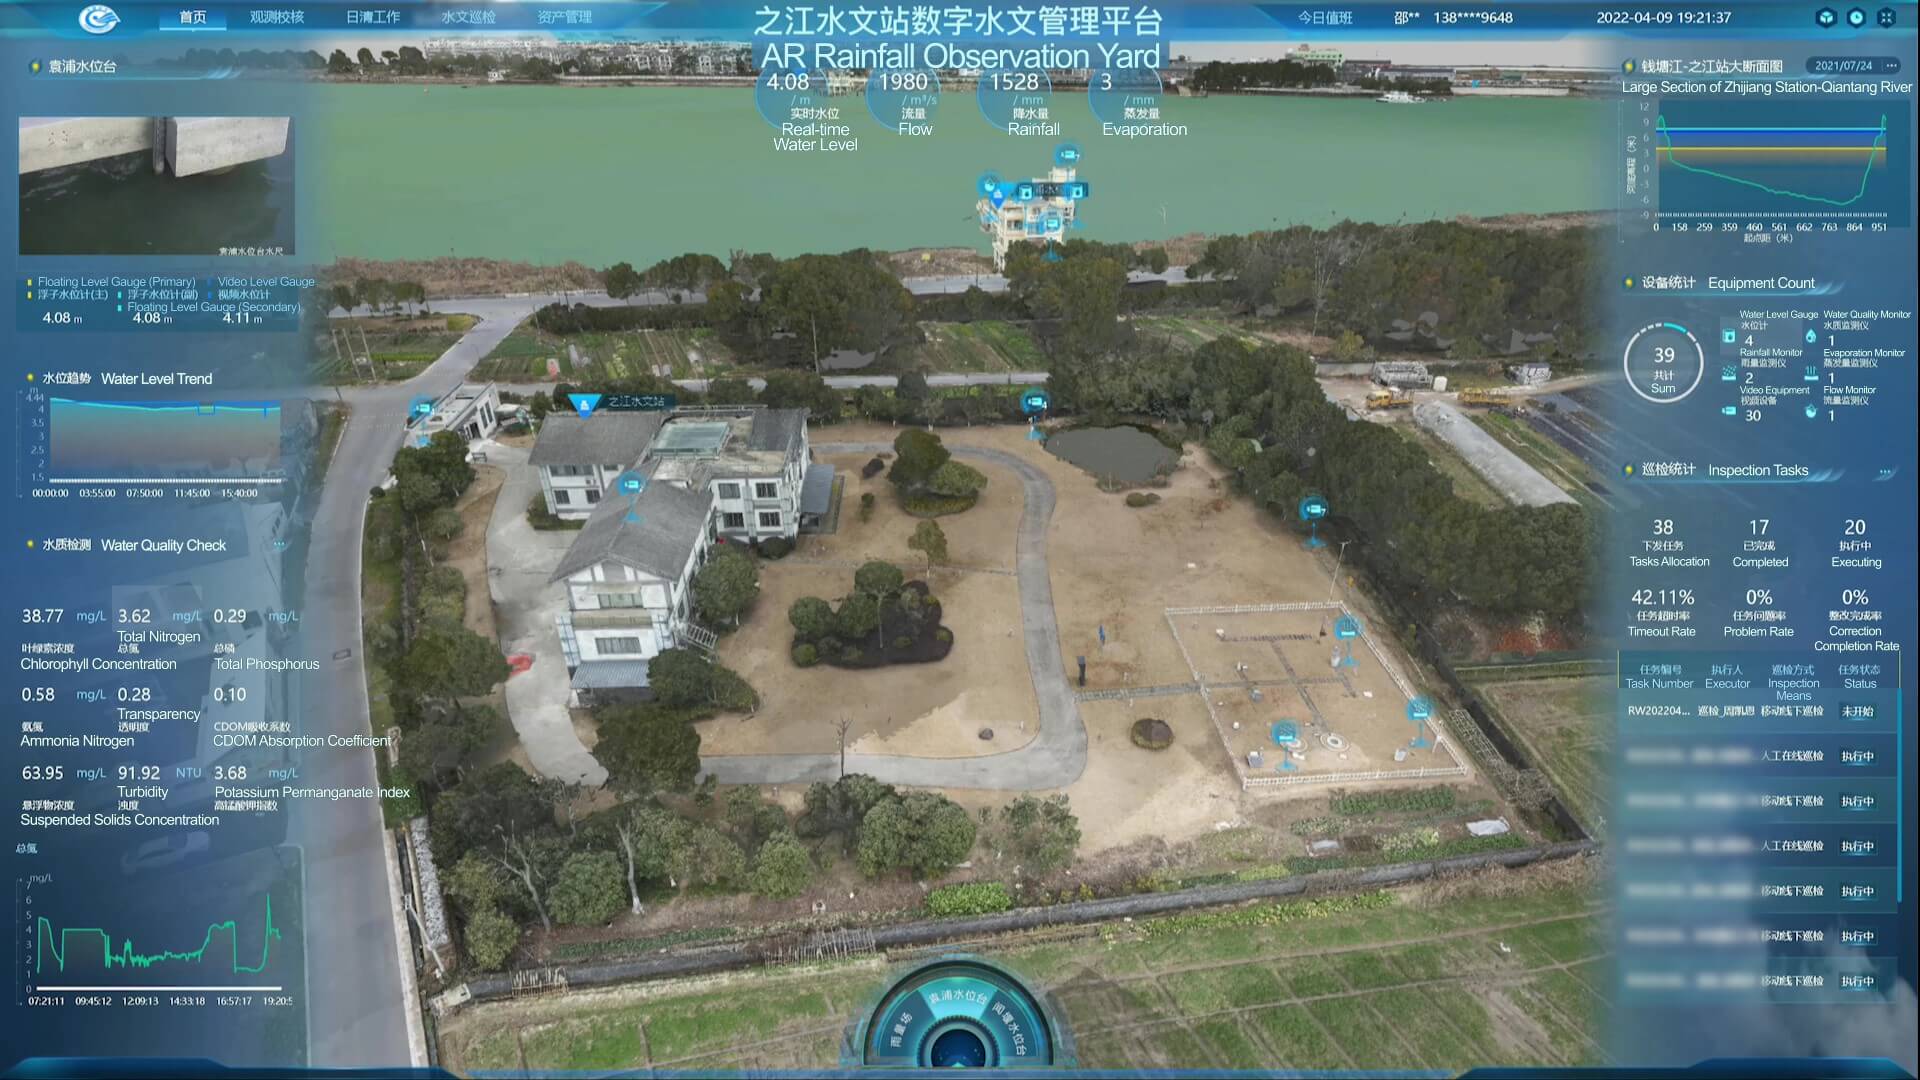
With all the different hydrological data accessed, the Daily Tasks And Work Management App automatically records and calculates the numbers, and differences are displayed directly. The app has substantially helped the researchers, as they can see from the screen the highest and lowest levels of a day and the corresponding time when those levels arrived. They can then easily compare these latest numbers to the historical records to see the size of any gap. The system automatically calculates the difference between the data collected by the primary and secondary monitoring devices. When the difference becomes too large or if there is any data missing, the system reminds the operators to make a correction.
An app that streamlines inspections
Through the Hydrological Inspection Management App, a manager can also allocate tasks like water level measurement, or leakage check for doors, windows or walls, and follow the status of task handling.
One of the two water level observing stations is 900 meters away on the opposite side of the river, which makes it troublesome to perform daily inspections. However, with the inspection engine-based technical capabilities in the app, both efficiency and quality of inspection work is improved.
Holographic display visualizes the data and smart alert sounds the timely alarm
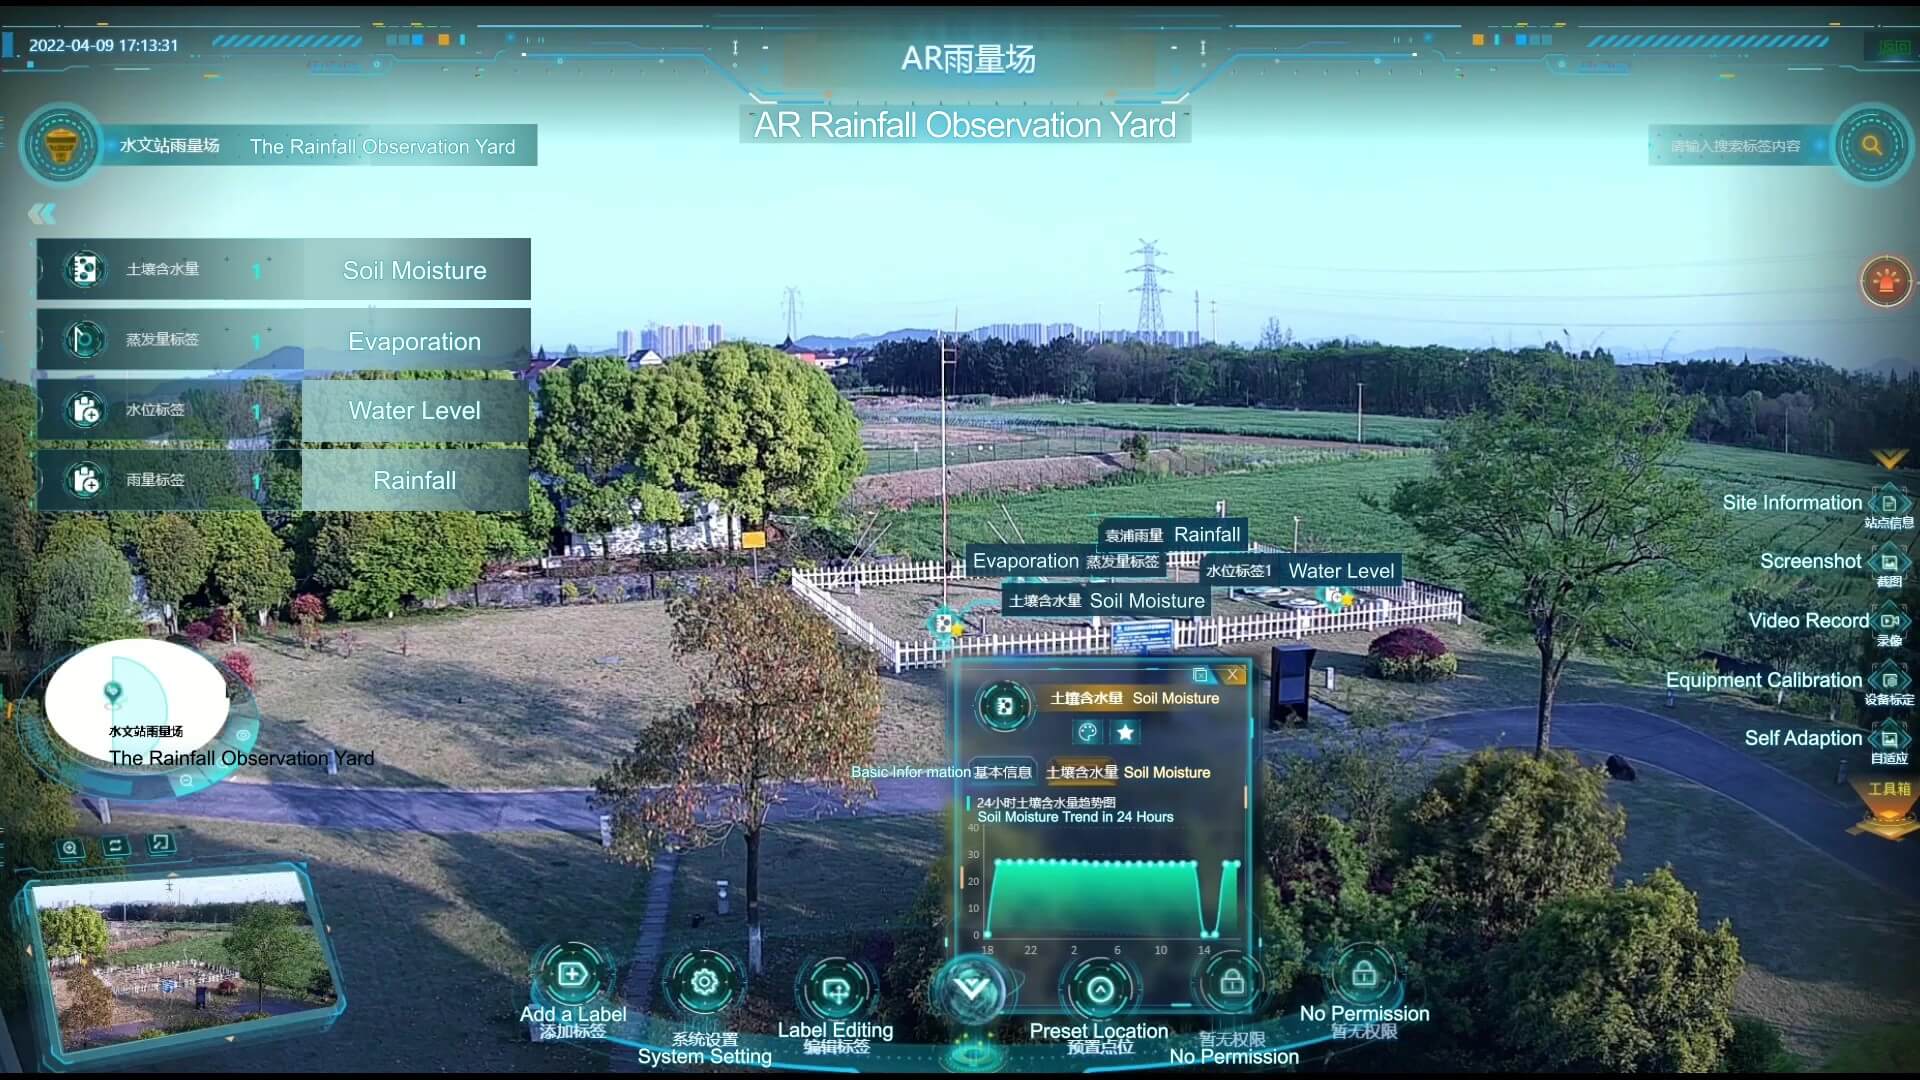
The application of AR brings visibility to a series of hydrological data that ranges from soil moisture, evaporation, and rainfall to the status of equipment. It enables a holographic display of all this information in real time, effectively helping researchers monitor changes of those hydrological indicators.


